Use Business Intelligence Software for Smarter Reporting: A Guide to Data-Driven Decisions
In today’s fast-paced business environment, data is no longer just a collection of numbers and figures. It’s a powerful resource that, when harnessed effectively, can drive strategic decision-making and propel organizations forward. One of the most effective tools for unlocking the potential of data is business intelligence (BI) software. This article explores how to use business intelligence software for smarter reporting, providing a comprehensive guide to leveraging its capabilities for improved insights and outcomes.
The core function of business intelligence software is to transform raw data into actionable insights. This transformation process involves collecting, analyzing, and visualizing data from various sources. The resulting reports and dashboards empower businesses to understand their performance, identify trends, and make informed decisions. The ability to quickly access and interpret data is crucial for staying competitive and responding effectively to market changes. This is where the power of business intelligence software truly shines.
Understanding Business Intelligence Software
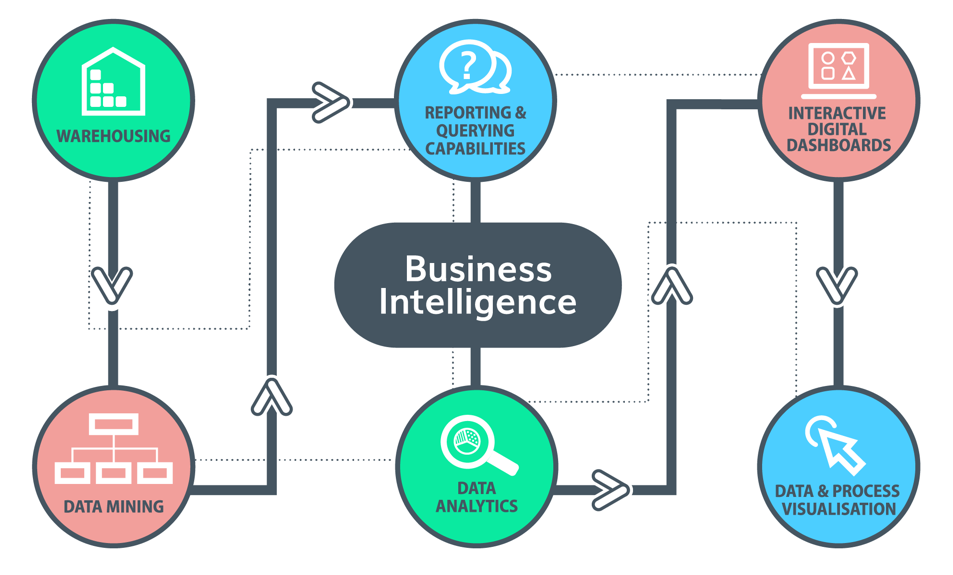
Business intelligence software encompasses a range of tools and technologies designed to collect, process, analyze, and present business data. These tools provide the framework for creating reports, dashboards, and visualizations that offer clear and concise insights. These insights enable businesses to monitor key performance indicators (KPIs), track progress toward goals, and identify areas for improvement. The key components of business intelligence software typically include data warehousing, data integration, data analysis, and reporting and visualization tools.
Data warehousing involves storing and managing large volumes of data from various sources in a central repository. Data integration tools facilitate the extraction, transformation, and loading (ETL) of data from different systems into the data warehouse. Data analysis tools provide the functionality to analyze data, identify patterns, and uncover trends. Finally, reporting and visualization tools enable users to create reports, dashboards, and interactive visualizations to communicate insights effectively. To truly use business intelligence software for smarter reporting, understanding these core components is essential.
Benefits of Using Business Intelligence Software
The advantages of business intelligence software are numerous and far-reaching. By providing access to real-time data and insightful analytics, business intelligence software empowers businesses to make data-driven decisions, improve operational efficiency, and gain a competitive edge. Some of the key benefits include:
- Improved Decision-Making: Business intelligence software provides a single source of truth for data, enabling users to make informed decisions based on accurate and up-to-date information.
- Enhanced Operational Efficiency: By automating reporting processes and providing insights into operational performance, business intelligence software can help businesses identify areas for improvement and streamline operations.
- Increased Revenue: By identifying market trends, customer preferences, and sales patterns, business intelligence software can help businesses optimize sales strategies and increase revenue.
- Better Customer Understanding: Business intelligence software enables businesses to analyze customer data, understand customer behavior, and personalize customer experiences.
- Competitive Advantage: By providing real-time insights into market trends and competitor activities, business intelligence software helps businesses stay ahead of the competition.
Key Features of Business Intelligence Software
When selecting business intelligence software, it’s important to consider the features that will best meet your specific needs. Essential features include:
- Data Integration: The ability to connect to and integrate data from various sources, including databases, spreadsheets, and cloud services.
- Data Visualization: Tools for creating interactive dashboards, charts, and graphs to present data in an easy-to-understand format.
- Reporting: Features for generating custom reports that provide insights into key performance indicators (KPIs) and other metrics.
- Data Analysis: Capabilities for analyzing data, identifying patterns, and uncovering trends using statistical and analytical techniques.
- Data Security: Robust security features to protect sensitive data from unauthorized access.
- Mobile Accessibility: The ability to access reports and dashboards from mobile devices, enabling users to stay informed on the go.
- User-Friendly Interface: An intuitive and easy-to-use interface that allows users to quickly access and interpret data.
How to Use Business Intelligence Software for Smarter Reporting
To effectively use business intelligence software for smarter reporting, follow these steps:
- Define Your Goals: Clearly define your business objectives and the specific questions you want to answer with data. This will help you determine the right metrics and reports to create.
- Choose the Right Software: Select business intelligence software that meets your specific needs, considering factors such as data integration capabilities, reporting features, and user-friendliness.
- Connect to Data Sources: Connect the software to your various data sources, such as databases, spreadsheets, and cloud services.
- Clean and Transform Data: Clean and transform your data to ensure accuracy and consistency. This may involve removing duplicates, correcting errors, and standardizing data formats.
- Create Reports and Dashboards: Design reports and dashboards that provide insights into your key performance indicators (KPIs) and other metrics. Use data visualization tools to present data in an easy-to-understand format.
- Analyze Data: Use data analysis tools to identify patterns, trends, and anomalies in your data.
- Share Insights: Share your findings with relevant stakeholders, such as managers, executives, and team members.
- Monitor and Refine: Continuously monitor your reports and dashboards, and make adjustments as needed to ensure they are providing the insights you need.
By carefully following these steps, you can effectively use business intelligence software for smarter reporting and unlock the full potential of your data.
Best Practices for Effective BI Reporting
To ensure the effectiveness of your BI reporting, adhere to these best practices:
- Focus on Key Metrics: Prioritize the most important metrics that align with your business objectives. Avoid overwhelming users with too much data.
- Use Clear and Concise Language: Use plain language and avoid technical jargon. Make sure reports and dashboards are easy to understand.
- Visualize Data Effectively: Choose the right type of chart or graph to represent your data. Ensure visualizations are clear, concise, and visually appealing.
- Provide Context: Add context to your reports and dashboards by including explanations, annotations, and comparisons to previous periods.
- Automate Reporting: Automate the reporting process to save time and ensure data is always up-to-date.
- Ensure Data Accuracy: Regularly check the accuracy of your data and make sure it is properly cleaned and validated.
- Train Users: Provide training to users on how to use the software and interpret the reports and dashboards.
- Gather Feedback: Collect feedback from users to improve the reports and dashboards. Iterative improvements are crucial.
Selecting the Right Business Intelligence Software
Choosing the right business intelligence software is a critical decision. The ideal solution will depend on your specific requirements, including your industry, the size of your organization, and the complexity of your data. Consider these factors when evaluating different options:
- Data Integration Capabilities: Ensure the software can integrate with your existing data sources.
- Reporting and Visualization Features: Look for tools that offer a wide range of reporting and visualization options.
- Ease of Use: Choose software with an intuitive and user-friendly interface.
- Scalability: Select a solution that can scale to accommodate your growing data needs.
- Security: Ensure the software offers robust security features to protect your data.
- Pricing: Consider the pricing models and choose a solution that fits your budget.
- Vendor Reputation: Research the vendor’s reputation and customer reviews.
Popular business intelligence software options include Tableau, Microsoft Power BI, Qlik Sense, and Looker. Researching these and other options is essential before making a final decision.
Real-World Examples of BI in Action
The impact of business intelligence software is evident across various industries. For example:
- Retail: Retailers use BI to analyze sales data, track inventory levels, and personalize customer experiences.
- Healthcare: Healthcare providers use BI to monitor patient outcomes, improve operational efficiency, and manage costs.
- Finance: Financial institutions use BI to detect fraud, manage risk, and optimize investment strategies.
- Manufacturing: Manufacturers use BI to monitor production processes, identify bottlenecks, and improve quality control.
These examples demonstrate the versatility and power of business intelligence software in transforming data into actionable insights.
The Future of Business Intelligence
The field of business intelligence is constantly evolving. Emerging trends include:
- Artificial Intelligence (AI) and Machine Learning (ML): AI and ML are being integrated into BI tools to automate data analysis, predict future trends, and provide more advanced insights.
- Self-Service BI: The rise of self-service BI tools empowers users to analyze data and create reports without relying on IT departments.
- Cloud-Based BI: Cloud-based BI solutions offer greater flexibility, scalability, and cost-effectiveness.
- Data Governance: Organizations are increasingly focused on data governance to ensure data quality, security, and compliance.
As these trends continue to develop, business intelligence software will become even more powerful and essential for businesses of all sizes.
Conclusion
Using business intelligence software for smarter reporting is no longer an option; it’s a necessity for businesses that want to thrive in today’s data-driven world. By embracing the power of BI, organizations can make data-driven decisions, improve operational efficiency, and gain a competitive edge. The key is to select the right software, implement it effectively, and continuously refine your reporting processes. The potential for growth and success is immense for those who embrace data intelligence. To truly succeed, start with understanding how to use business intelligence software for smarter reporting.
[See also: Data Visualization Best Practices, Choosing the Right BI Tool, Data Analysis Techniques]

